Audience Measurement
Audience counting with age and gender estimation, linked to ad-play data.
Audience counting
The Display Science AI platform counts the audience at the screen and estimates age and gender.
Linked with delivery
Measurement data is linked with campaign delivery. Ad-play data and audience data are combined in real-time dashboards.
API access
Measurement data can also be exposed to external systems via API.
With or without the CMS
Audience measurement can operate with the Display Science CMS or be integrated independently.
Inside the advertiser dashboard
This dashboard comes from a real in-car campaign in Singapore. The screens are touch-screen tablets in cars. We hid the name and the artwork of the advertiser. The dashboard labels ad plays as "Impressions".
What played
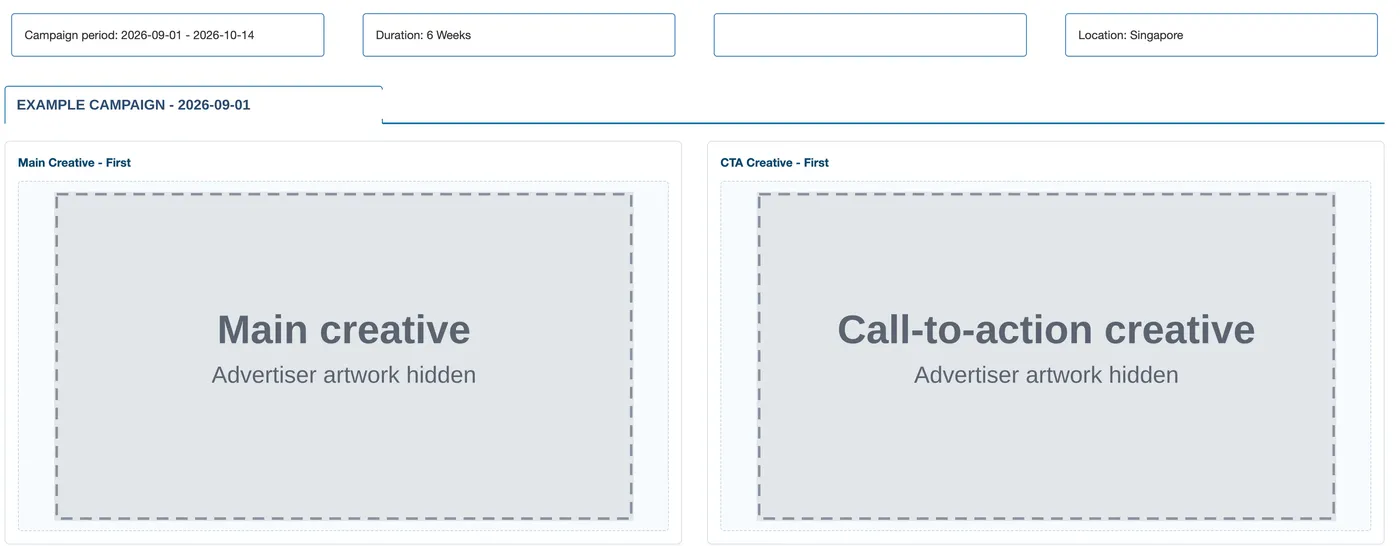
Each campaign has a main creative and a call-to-action creative.
The top of the dashboard shows both creatives, with the campaign period, the duration and the location.
Headline results
Three totals: ad plays, engagements and the engagement rate. An ad play is one play of the ad on one screen. An engagement is one passenger tap on the main creative.
The engagement rate is engagements divided by ad plays.
Pick a start date and an end date to redraw every chart for that period. The campaign dates do not change. The advertiser can download the campaign data as an Excel (XLSX) file.

Who watched
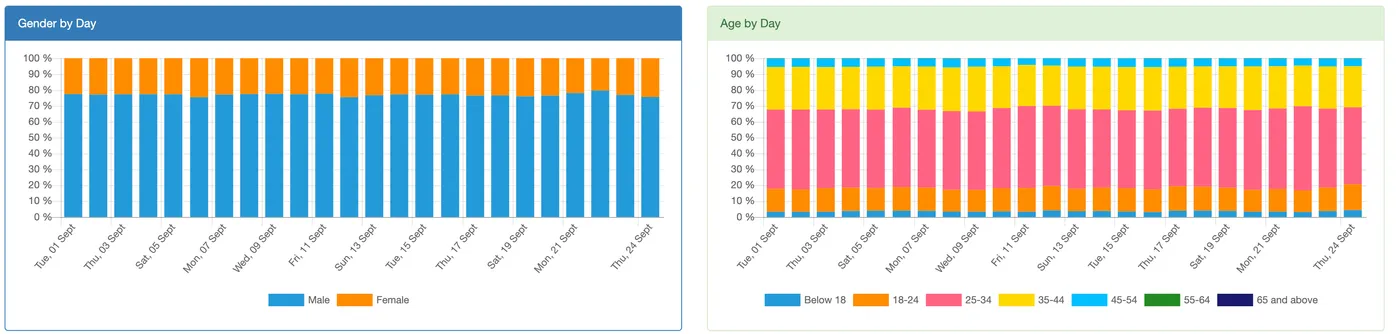
Audience measurement estimates the gender and the age group of the audience.
The dashboard shows the split for the whole campaign and for each day.
When it played
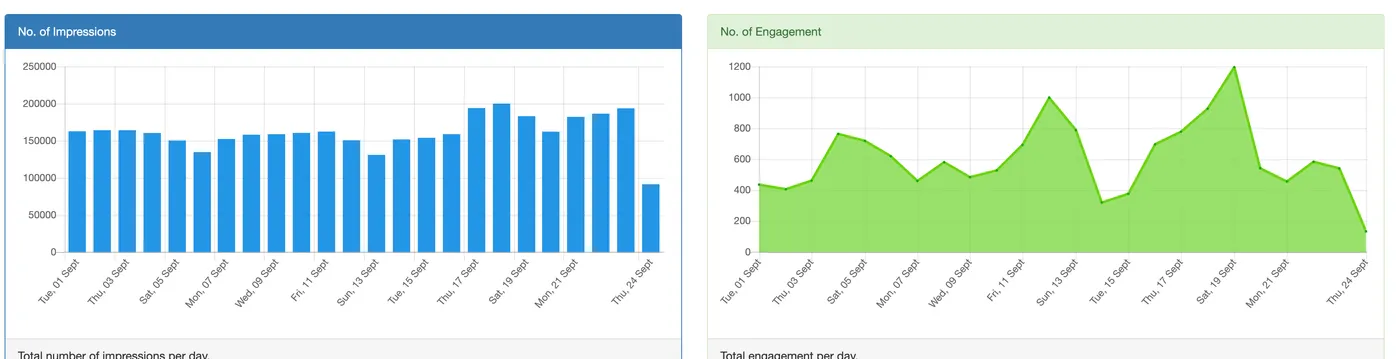
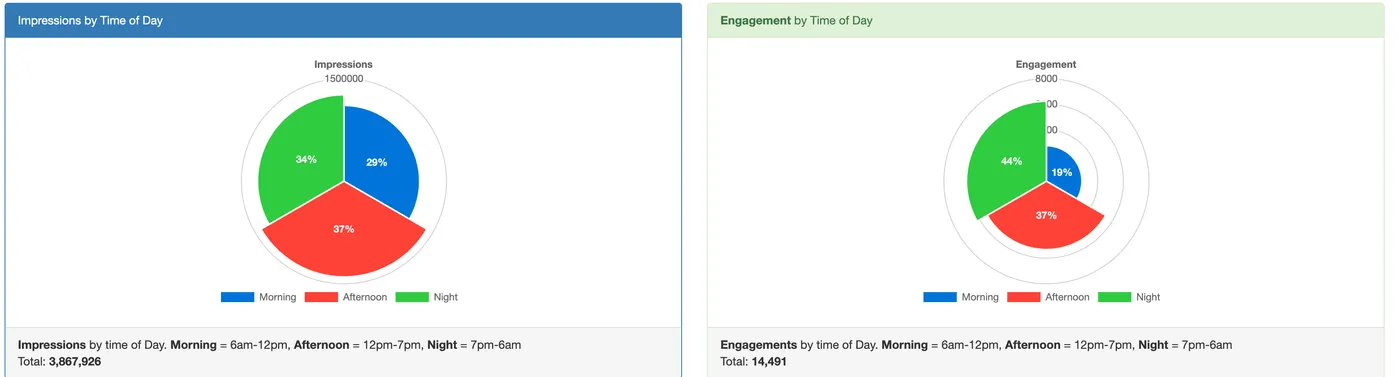
Ad plays and engagements for each day of the campaign, for each day of the week, and for each time of day.
Morning is 6am to 12pm. Afternoon is 12pm to 7pm. Night is 7pm to 6am.
Where passengers tapped
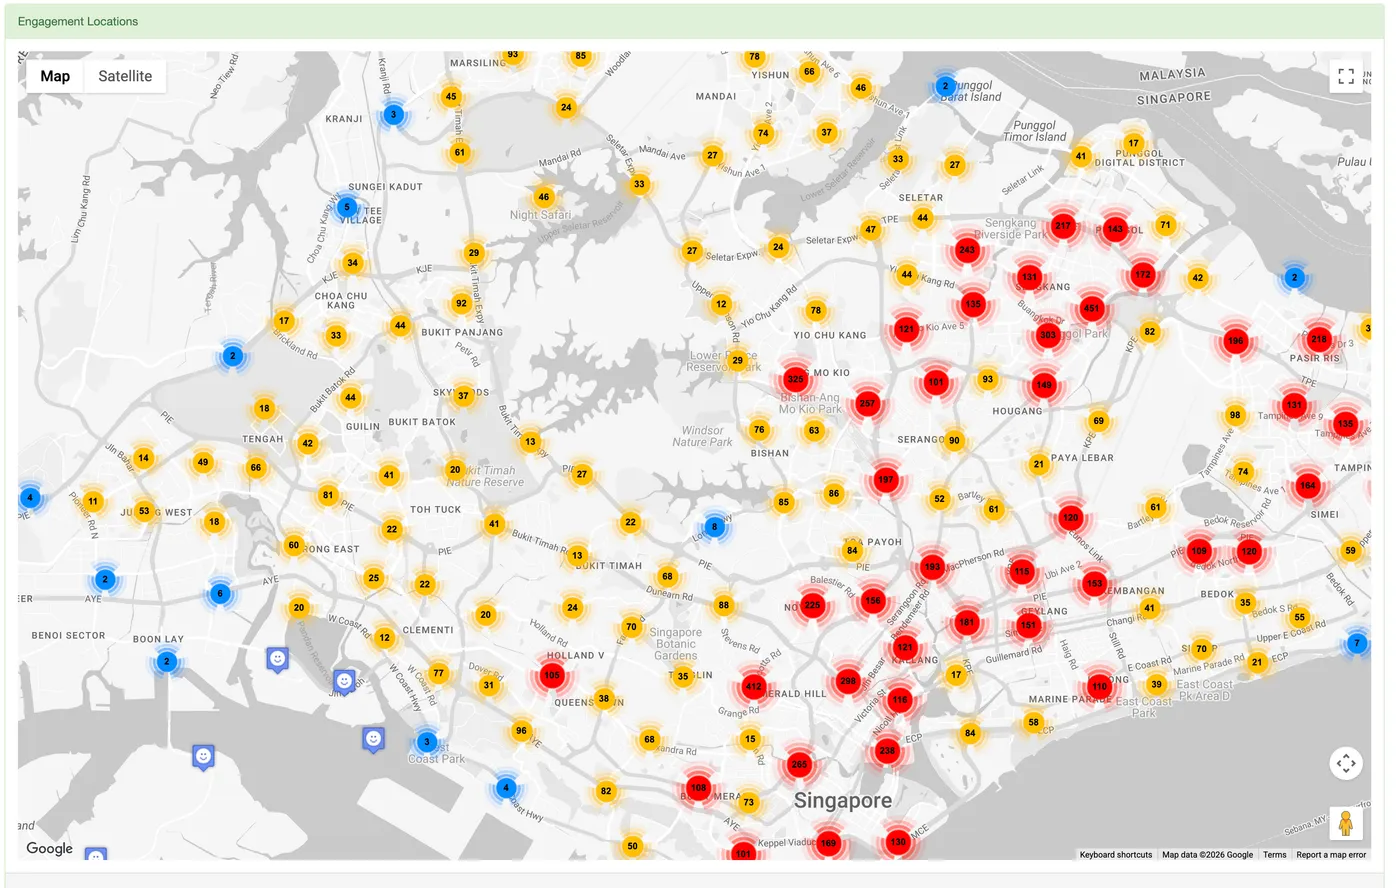
A map shows where passengers tapped the ad. Each marker groups the taps in one area and shows how many there were.